Implements the rolling ball baseline correction method
Value
A list with three components:
- baseline
Numeric vector containing the estimated baseline values
- corrected
Numeric vector containing the baseline-corrected signal (original - baseline)
- original
Numeric vector containing the original input signal
Examples
# Example with simulated data
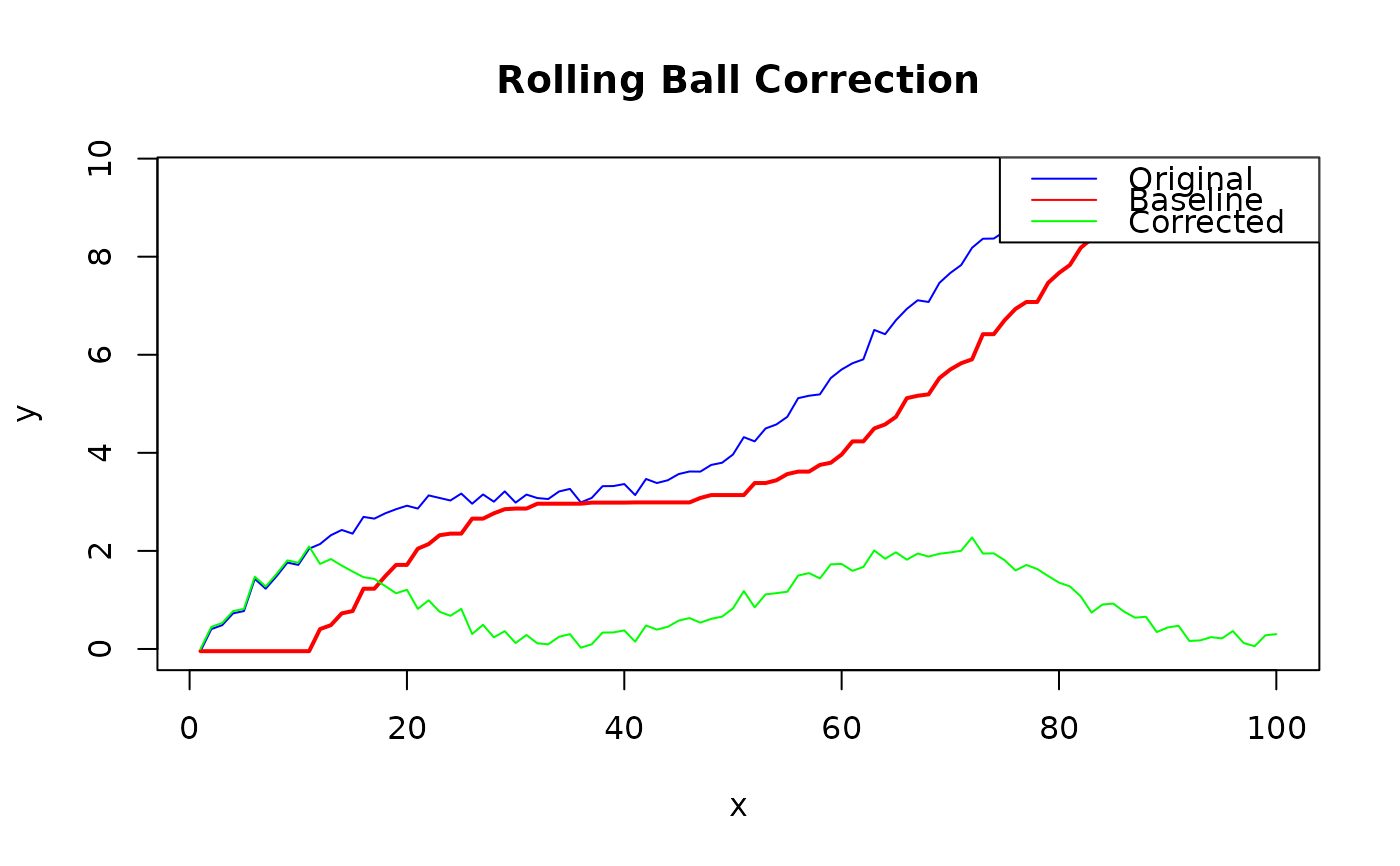
x <- seq(1, 100, by = 1)
y <- sin(x/10) + 0.1*x + rnorm(100, 0, 0.1)
result <- rolling_ball(y, wm = 10)
plot(x, y, type = "l", col = "blue", main = "Rolling Ball Correction")
lines(x, result$baseline, col = "red", lwd = 2)
lines(x, result$corrected, col = "green")
legend("topright", c("Original", "Baseline", "Corrected"),
col = c("blue", "red", "green"), lty = 1)